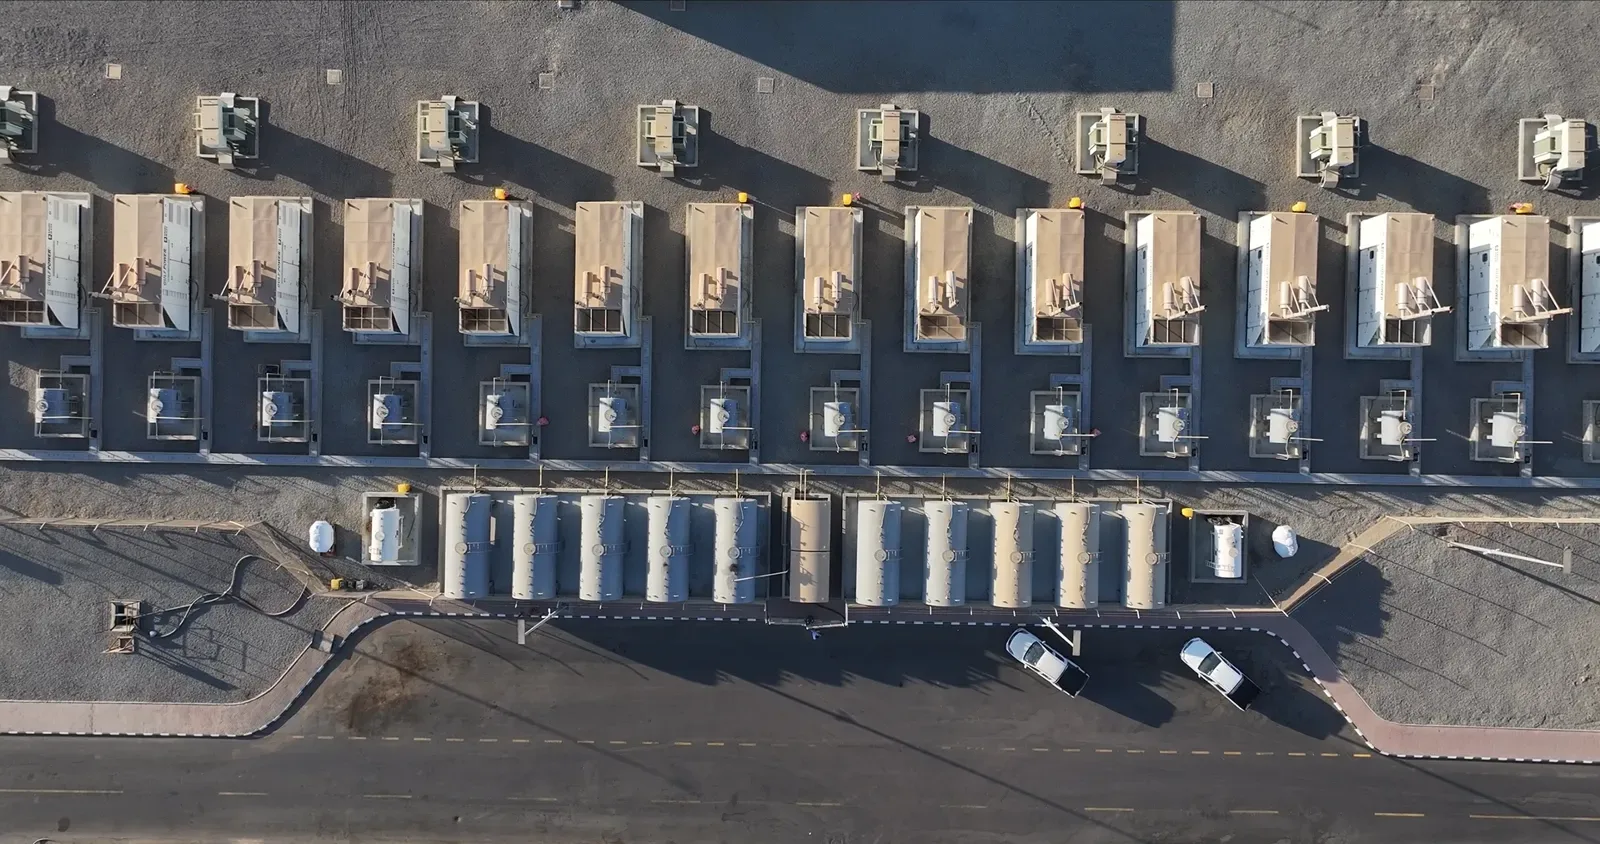
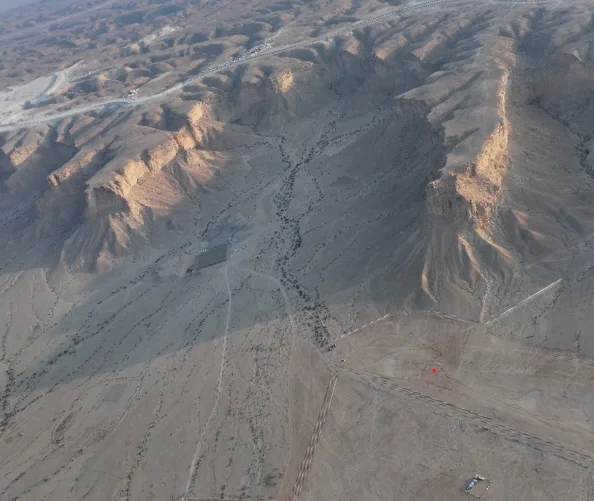
The site sits in a basin at the foot of the Tuwaiq escarpment, west of Riyadh. Cliffs wrap its northern and eastern edges, the basin opens south onto flat desert, and a drainage canal has been cut to carry cliff runoff around the site. The question is simple: in a heavy storm, where does the water come from, how much of it arrives, and where does it go?
The site was surveyed by drone for Qiddiya. The figures on this page come from our later rebuild of the analysis from the raw survey data. It is a planning-grade model that shows the method end to end and states its limits. It is not a design study.
The project at a glance
| Location | Qiddiya, at the foot of the Tuwaiq escarpment west of Riyadh |
|---|---|
| Survey area | About 2.7 km² |
| Aircraft | DJI Mavic 3, without RTK |
| Terrain model | Bare-earth DTM at 0.5 m, elevations 612.6 to 674.4 m |
| Catchment above the cliffs | Copernicus GLO-30 elevation model at 30 m |
| Hydrology | HEC-HMS, two subbasins |
| Hydraulics | HEC-RAS 2D, 21,107 cells on a 10 m mesh |
| Coordinate system | WGS 84 / UTM 38N |
From survey to terrain
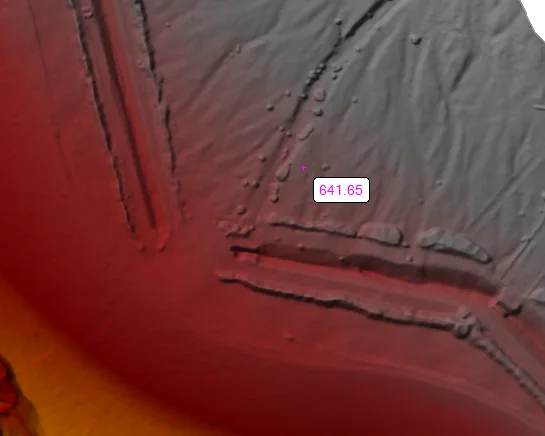
We processed the survey images into a point cloud, classified the ground points and produced a 0.5 m terrain model in which the cut drainage canals show clearly. Inside the site the ground falls 25 to 30 m from the cliff toe to the southern opening.
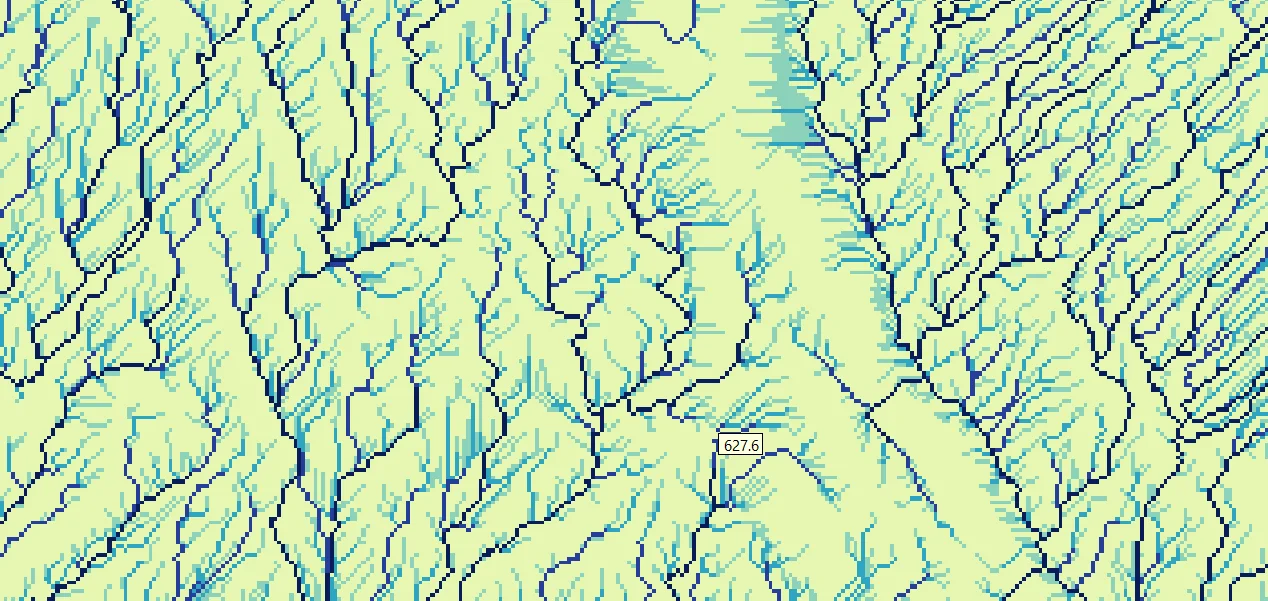
The survey covers the site, not the cliffs above it, so we used the Copernicus GLO-30 elevation model to trace the catchments that drain onto the site.
How much water arrives
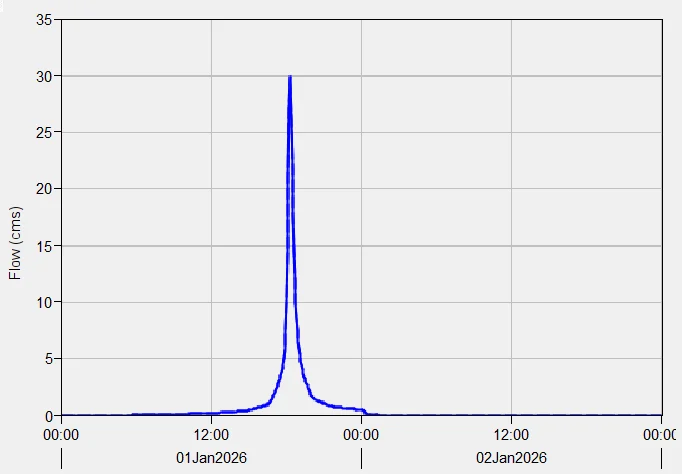
In HEC-HMS we split the catchment in two: the cliff catchment (1.75 km², curve number 94) and the south-western edge (1.17 km², curve number 88). Losses use the SCS curve number method and runoff the SCS unit hydrograph, with no baseflow.
The storm is a 50-year, one-day frequency storm: 40 mm in the peak hour and 80 mm over the day. Those depths come from a generic arid-region intensity curve fitted for this model, not from an official Riyadh rainfall study, and we say so alongside the results.
| Inflow | Peak flow | Runoff depth |
|---|---|---|
| Cliff catchment | 30.0 m³/s | 63 mm |
| South-western edge | 13.2 m³/s | 49 mm |
The model matched a hand calculation of SCS runoff to within 0.3 mm. The cliff catchment delivers about 70% of the peak flow and two thirds of the volume.
Where it goes
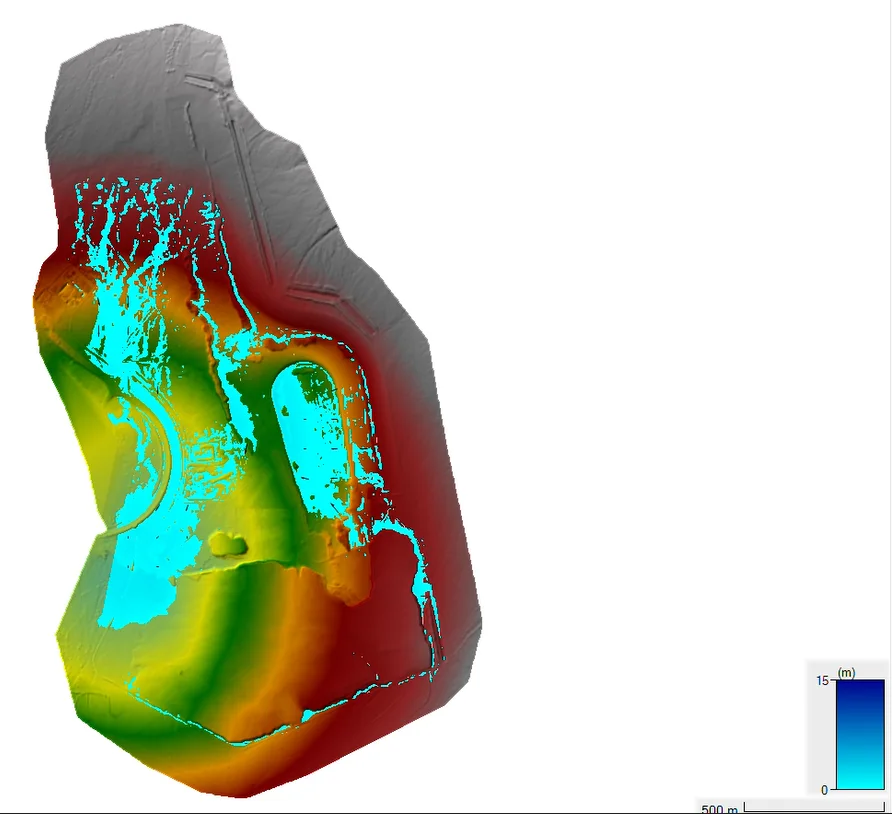
In HEC-RAS we built a 2D flow area over the basin: 21,107 cells on a 10 m mesh, solved with the diffusion-wave equations at a 5-second time step. The two hydrographs enter along the cliff toe and the south-western edge, and water leaves through the southern opening.
The depth maps show the flow paths from the cliff toe, where the water gathers and how it drains south. Results were saved every 15 minutes, which gives a time series for the whole event.
The limits, stated plainly
The survey was flown without RTK, so absolute heights are less certain than in an RTK survey. Flow direction depends on relative slope inside the site, which holds up; absolute levels do not.
A 10 m mesh does not resolve the canal, so this run does not tell you whether the canal has enough capacity. That needs a finer mesh with the canal entered as a breakline.
Roughness is a single Manning’s n of 0.030 across the site, and the model has no underground drainage, so the results are the surface response alone. The rainfall depths are illustrative; a design study would use an official intensity curve for the site.
| Use | Suitability |
|---|---|
| Seeing where runoff comes from, where it gathers and where it leaves | Suitable |
| Planning site layout, access and early drainage routes | Suitable, as a screening tool |
| Sizing the canal, culverts or other drainage structures | Not from this run; needs a design rainfall curve, a finer mesh and surveyed levels |
| Flood-risk or engineering design submission for approval | Not suitable; needs a licensed engineering study |
What a study like this produces
- DTM, DSM and orthomosaic from the survey
- Subbasin boundaries and the stream network as GIS layers
- The HEC-HMS model and a hydrograph for each inflow point
- The HEC-RAS model with depth, velocity and water-surface maps for each time step
- An animation of the event
- A report that states the assumptions and limits