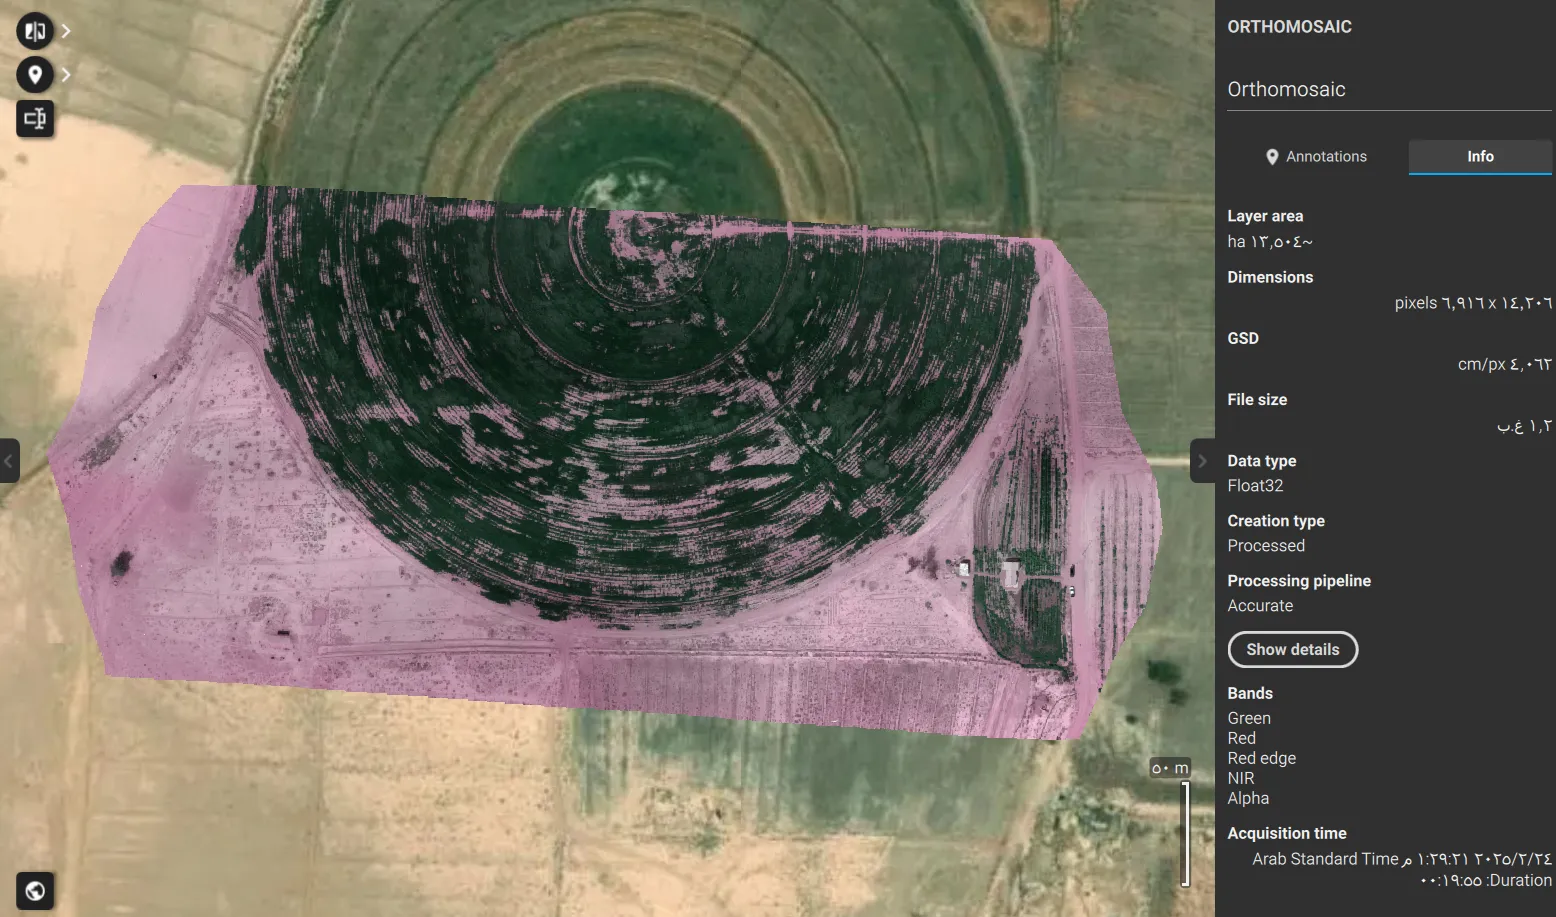
A vegetation map of a whole palm farm is mostly a map of the soil between the palms. Bare ground drags every average down, so a farm can look stressed when the trees are fine, or look fine when a group of palms needs attention.
On this 9.3 ha farm the aim was to separate each palm from the ground around it and give it its own values, so the owner knows which palms to walk to first.
The project at a glance
| Area | 9.3 ha |
|---|---|
| Crop | Date palm |
| Capture | 13 April 2026 |
| Aircraft | DJI Mavic 3 Multispectral |
| Images | 2,294 |
| Ground sample distance | About 8 mm |
| Positioning | Network RTK through GEOSA’s VRS |
| Reference frame | KSA-GRF17 |
How we got to each palm
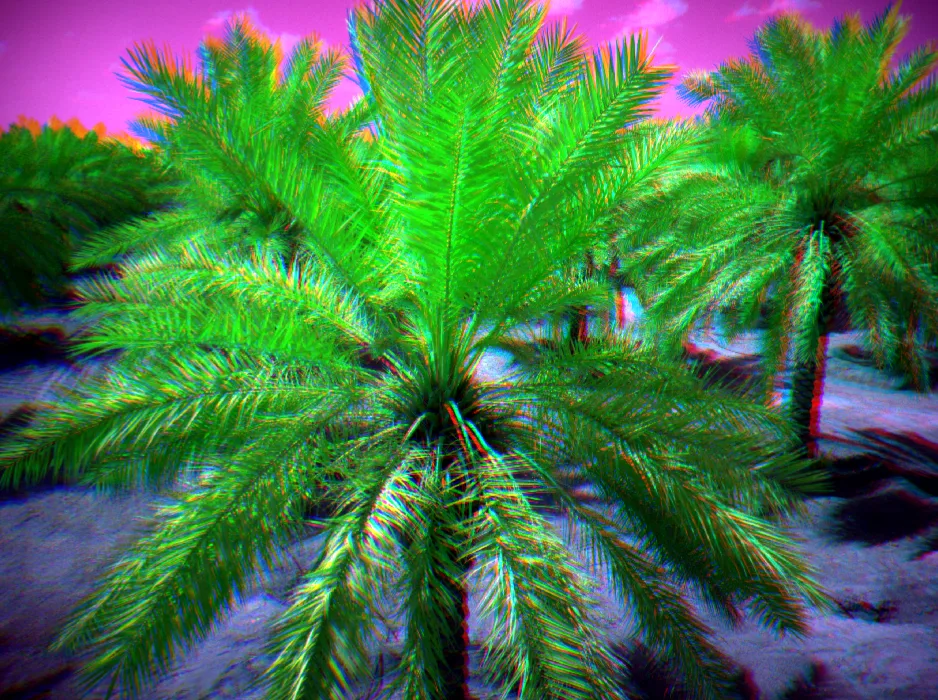
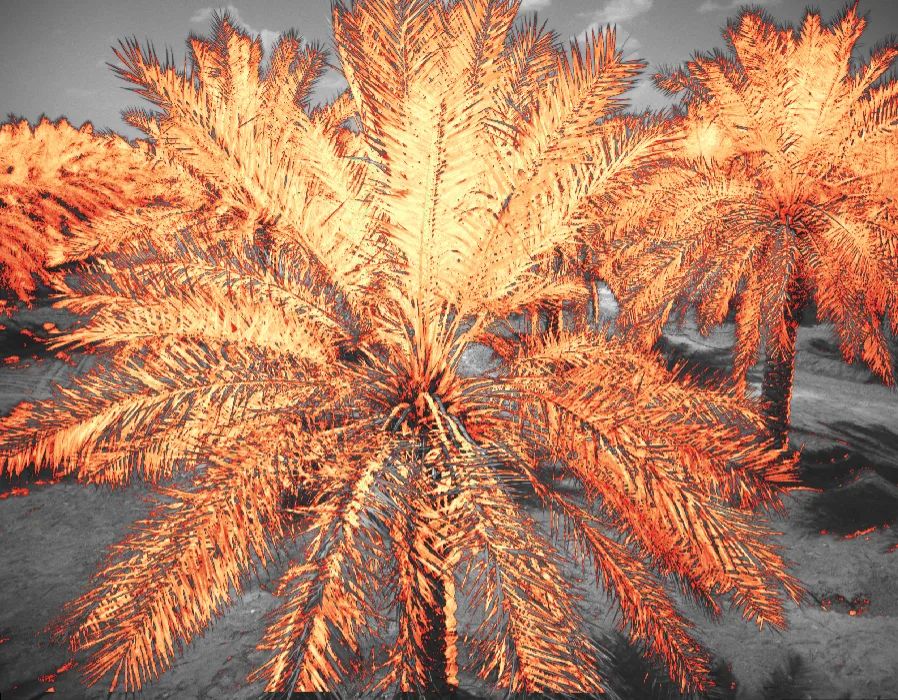
From the survey we built a canopy height model: surface height minus ground height. In it the palms stand clear of the soil and the irrigation lines between them.
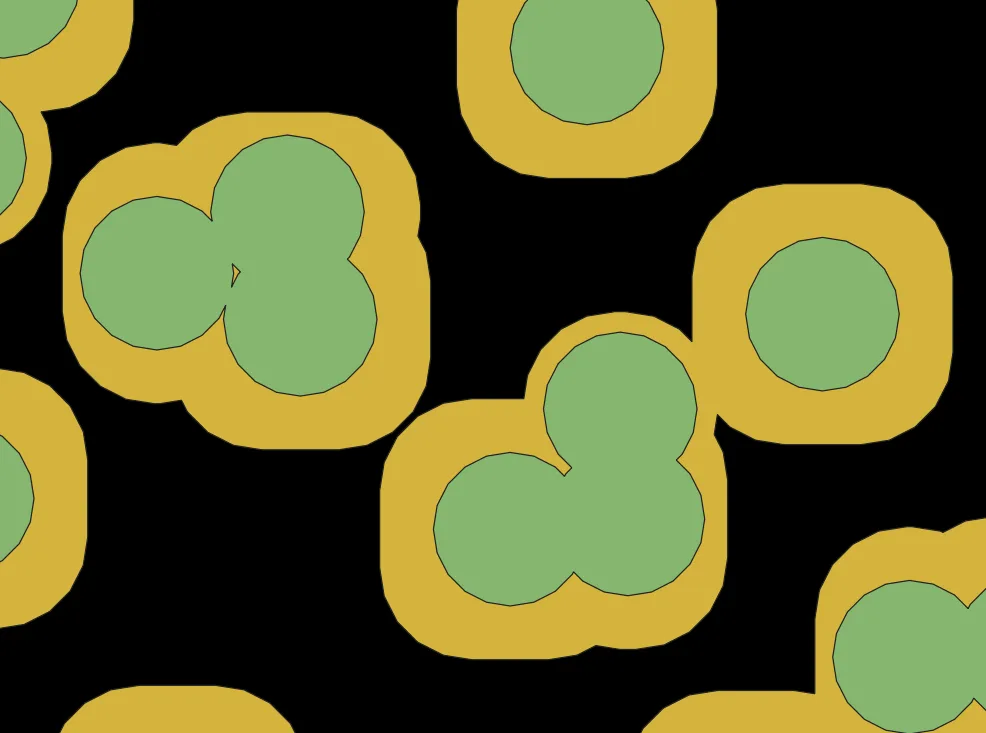
The highest point of each crown marks one palm, and we drew a crown outline around it. Inside each outline we averaged two indices: NDVI, which follows overall green vigour, and MCARI, which uses the red-edge band and responds more to leaf chlorophyll. When the two disagree on a palm, that palm is worth a closer look.

The result, and what it does not say
We rated the farm moderate overall, and chose the word with care. An index shows where a palm reflects light differently from its neighbours. It does not say why: water, nutrition, pests, the age of the palm or the timing of the last irrigation can all give the same low reading.
| Use | Suitability |
|---|---|
| Ranking palms and blocks for field inspection | Suitable |
| Tracking the same palms across seasons, with matched flight time and calibration | Suitable |
| Finding the cause of a low reading, such as irrigation, nutrition or red palm weevil | Not on its own; needs a field visit or a lab test |
| Yield estimates | Not from a single survey |
What you receive from a survey like this
- Reflectance maps for each band: green, red, red edge and near-infrared
- Index maps: NDVI, NDRE and MCARI
- A table with one row per palm: ID, location, crown area and index values
- GIS layers ready for your mapping software
- A short report naming the palms and blocks to inspect in the field